Risk management
Short-term and long-term safety, health, wellbeing and sustainable development risks are a reality of our work
We make sure that we have effective risk management strategies in place to address and minimise them by:
- providing safety assurance for our passengers, workforce and members of the public that may be affected by our work
- having all the information we need to take risk-based decisions around safety, health, wellbeing and sustainable development activities
- are fully compliant with all current rules and regulations.
BowTie risk assessments
BowTie is a tool that we use to support the analysis, communication and consultation of the risk management process. It’s defined by its centre, which is the key risk (or loss event) within the scope. The left-hand side details all the causes (or threats) that could lead to the risk at the centre. The right-hand side details the effect (or consequences) when the risk at the centre materialises.
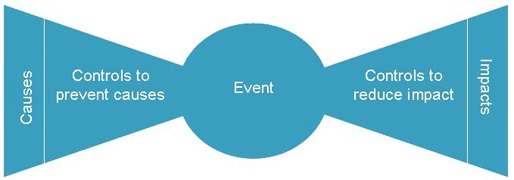
A BowTie risk assessment also demonstrates controls that are in place to prevent the risk materialising and the mitigations for damage limitation and cost containment once the risk has materialised. It also shows the effectiveness of the controls.
Horizon scanning
Horizon scanning is the process of identifying and analysing risks that may impact on an organisation. It includes identifying risks associated with negative impact, as well as any beneficial opportunities.
Our Safety, Technical and Engineering (STE) Horizon Scanning Group assists with identifying any items (technology, events, practices and trends) external to the business that could pose a risk to our safety or sustainable development objectives.
Precursor Indicator Model
The Precursor Indicator Model (PIM) is produced by the Rail Safety and Standards Board (RSSB) as a quantified risk model for understanding train accident risk. It’s released periodically and demonstrates quantitatively the level of train accident risk and how it’s changing.
We collect data on the presence of precursors to train accident risk (broken rails, signals passed at danger, or SPADs, and bridge strikes, for example) and compare any changes to the incidents used for the most recent Safety Risk Model (SRM) figures, which are also produced by the RSSB.
We display PIM data as a moving annual average to avoid any unusual data ‘spiking’. The data is also profiled by train miles. Our STE Risk Management team performs further analysis on PIM data so that they can highlight areas of interest.